Google™ Search
December 25, 2025
The RBVI wishes you a safe and happy holiday season!
See our
2025 card and the
gallery of previous cards back to 1985.
September 22, 2025
Mac users may wish to defer upgrading to MacOS Tahoe.
Currently on that OS the Chimera graphics window is shifted so that it covers
the command and status lines.
March 6, 2025
Chimera production release 1.19 is now available,
fixing the ability to fetch structures from the PDB
(1.19 release notes).
Previous news...
Please note that
UCSF Chimera is legacy software that is no longer being developed or supported.
Users are strongly encouraged to try
UCSF ChimeraX, which is under active development.

UCSF Chimera is a program for the interactive visualization
and analysis of molecular structures and related data,
including density maps, trajectories, and sequence alignments.
It is available free of charge for noncommercial use.
Commercial users, please see
Chimera commercial licensing.
We encourage Chimera users to try ChimeraX
for much better performance with large structures, as well as other major
advantages
and completely new features in addition to nearly all the capabilities
of Chimera (details...).
Chimera is no longer under active development.
Chimera development was supported by a grant from the
National Institutes of Health (P41-GM103311)
that ended in 2018.
The Blast Protein tool
performs a blast or psiblast search of
pdb or nr for sequences similar
to a query, using a Web service hosted by the
UCSF RBVI.
The query can be:
- a chain from a structure open in Chimera
- a sequence pasted as plain text
- a sequence from an alignment in
Multalign Viewer
The output is a list of hits, from which all or a user-chosen subset
can be retrieved:
- as a pseudo-multiple sequence alignment (a consolidation
of the pairwise alignments of individual hits to the query),
automatically shown in
Multalign Viewer
- as structures (for hits from pdb),
automatically superimposed according to the pseudo-multiple alignment
(More features...)
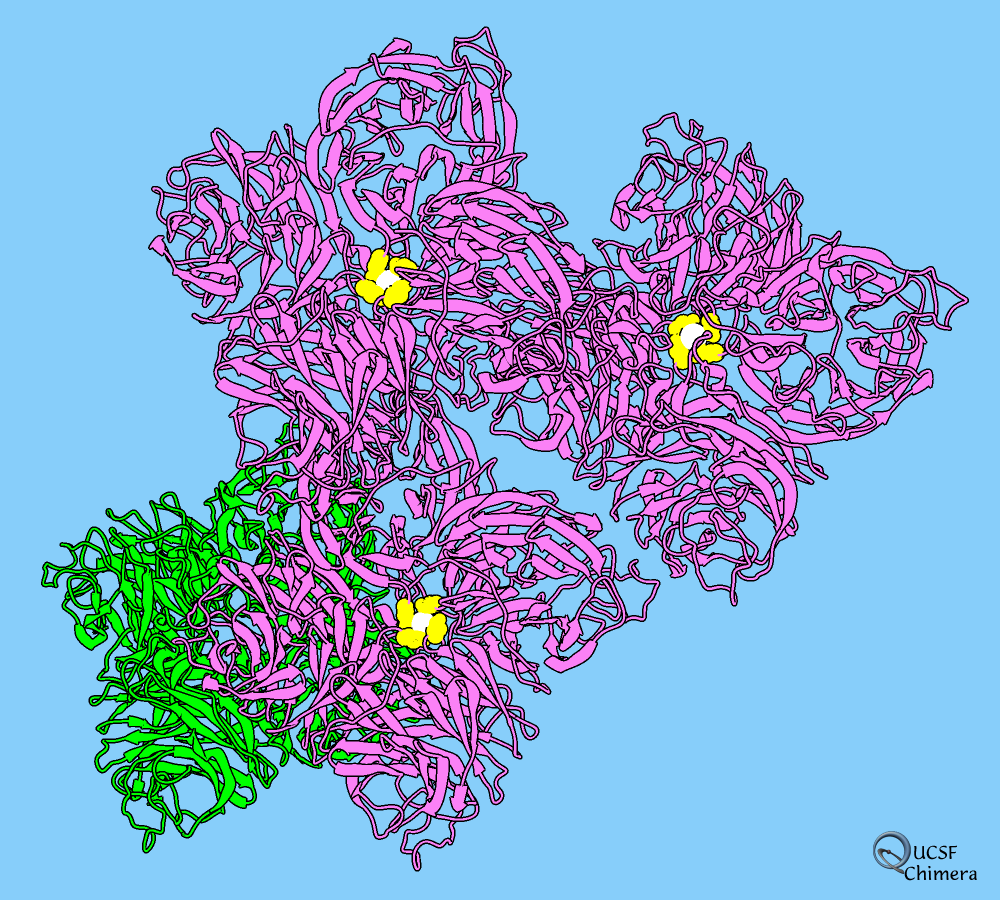
The image shows tetramers of influenza neuraminidase
(Protein Data Bank entry
3k3a) styled as flowers.
Three tetramers are colored pink,
with a central metal ion in white and nearby residues in yellow,
and a fourth tetramer is colored green to resemble leaves.
Each monomer or “petal” is a six-bladed β-propeller.
(More samples...)


")
